See the Story Your Data is Trying to Tell
We design intuitive, compelling visualizations that make complex datasets easy to understand for all stakeholders. Move beyond spreadsheets and engage with your data through clarity and insight.
Transform Your Data
Visualization Capabilities
Diverse, scalable solutions tailored to your business intelligence needs.
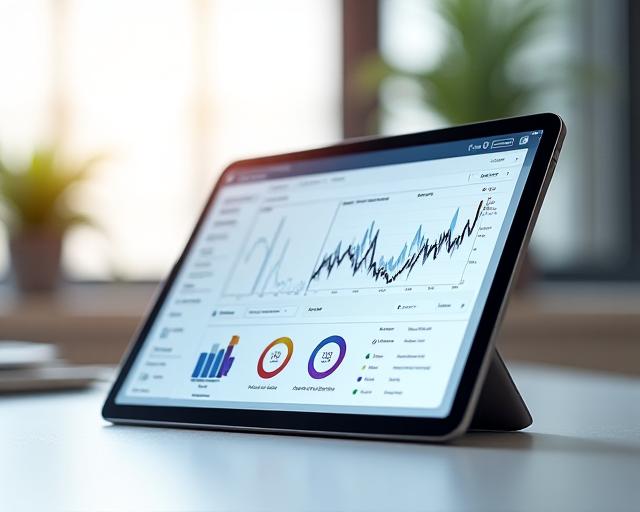
Financial Modeling
Advanced trend analysis charts that reveal fiscal health and seasonal growth patterns at a glance.
Geospatial Mapping
Visualizing sales, logistics, and demographic data across global maps to optimize regional strategies.
Customer Journeys
Understand retention and friction through cohort analysis and interactive funnel visualizations.
Predictive Models
Interactive forecast models that leverage AI to project future outcomes based on historical data.
Turn Data into Strategy
Our visualization services don't just look good—they provide actionable intelligence. By distilling the 'Iceberg' of raw data into visible, clear trends, we empower your team to make decisions with confidence.
- High-contrast dark-blue theme integration
- Real-time data stream connectivity
- Mobile-responsive interactive layers